The NXT built in rotation sensors and timers provide an ideal way to measure the effect of different power settings used in move blocks. Measuring rotations per second versus percent power allows us to obtain a useful characterization of motor performance.
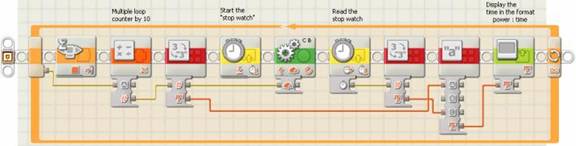
The Tribot, a three wheel vehicle, provided the test vehicle used to obtain the following test results. The Tribot has two drive wheels, with tires, connected directly the motor drive shafts, a third, castor wheel provides stability. The NXT, itself is used to time the completion of two rotations of the motors shafts. The following NXT-G program uses the loop counter, multiplied by ten, for a input to the move block wiring hub power input. Two timer blocks supply the "stop watch" function. The timer gets reset to zero, the motor turned on for two rotations, and then the timer block gets read. The value read from the timer, along with the power setting get displayed on the NXT LCD display. A NXT push-button provides a means of stepping through increasing power settings.
Table 1 shows the time it takes to move two rotations for different power settings. The table lists the results for three trials of power settings ranging from 10 to 100 percent power. For each power setting three trials, or measurements, provides assurance that the data accurately represents real-life behavior. We would be concerned only if one of the measurements resulted in a radically different value than the other two trials. From the measured time it takes the motor shafts to turn two times use the following formula to calculate rotations per second
Rotations per second = 2 / time(in seconds)
For example, we notice at 50% power two rotations of the motor shafts takes an average of 2.425 seconds. (Note that the timer's 1 millisecond accuracy allows for three digits of accuracy behind the decimal point.) To calculate the rotations per second divide 2 by 2.425 seconds to get 0.825 rotations per second (RPS).
| Power Setting |
Time for 2 rotations (seconds) |
Average | RPS | ||
|---|---|---|---|---|---|
| Trial 1 | Trial 2 | Trial 3 | |||
| 10 | 17.357 | 17.000 | 0.118 | ||
| 20 | 5.513 | 5.64 | 5.695 | 5.616 | 0.356 |
| 30 | 3.752 | 3.799 | 3.831 | 3.794 | 0.527 |
| 40 | 2.805 | 2.84 | 2.869 | 2.838 | 0.705 |
| 50 | 2.4 | 2.418 | 2.458 | 2.425 | 0.825 |
| 60 | 1.995 | 2.017 | 2.055 | 2.022 | 0.989 |
| 70 | 1.759 | 1.753 | 1.767 | 1.760 | 1.137 |
| 80 | 1.565 | 1.503 | 1.521 | 1.530 | 1.307 |
| 90 | 1.36 | 1.38 | 1.38 | 1.373 | 1.456 |
| 100 | 1.187 | 1.201 | 1.209 | 1.199 | 1.668 |
Charts 1 below shows average time for two rotations vs percent power plotted on an x-y graph. Similarly chart 2 shows rotations per second vs percent power.
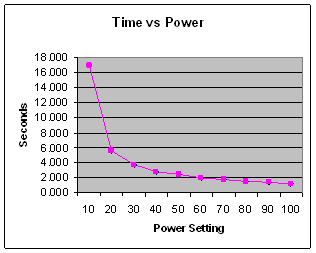
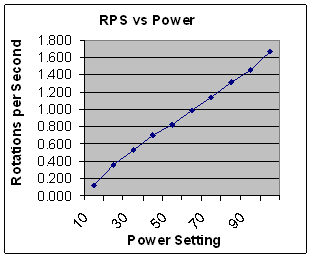
The motors do, in fact appear to increase speed linearly with increased power. The above measurements apply for the torque profile of the motor shafts when loaded by the Tribot wheels and body. An interesting experiment would be to use a device or model that allows for a constant, settable torque on the motor shafts. Such an experiment would provide a much more complete characterization of the motors. The reader is referred to the references for other research in this area.