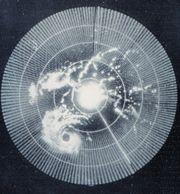
The NXT-G allows the use of rudimentary graphics drawing functions to create an image on the NXT LCD display. One use of the display involves creating a "radar style" image of objects detected with the Ultrasonic (US) sensor. For example, your robot might have the ability to rotate the US sensor around in a circle and take distance readings while rotating. The following program demonstrates how to convert these readings into a radar style display in which objects are displayed in a polar graph format. Furthermore, the process of converting the data from the US sensor to "blips" that can be displayed on the NXT display generates data that can be used by a robot to "map" out its surroundings.
The program presented below, along with the source code provided, creates a data generated display. That is, the program demonstrates how typical data from the US sensor can be displayed in a radar style display. The program actually simulates data from a real US sensor by reading the typical data from a file stored on the NXT. This data file contains data similar to what might be generated by the US sensor mounted on a real-life robot. Also, below you will find an example of how to convert the data driven program to a real-life sensor driven program. For examples of robots that can use the US sensor as a "radar" the reader may refer to several NXT blogs that show readily adaptable models.
The secret to displaying data derived from the US sensor on the NXT's display lies in converting the data from the sensor to data that can draw images on the NXT display. The following discussion applies to a sensor that stays in a fixed location while rotating in a circle scanning for objects. A real-life radar works in a similar fashion. The radar antenna directs a radio beam outward. When the beam gets reflected by an object, such as an aircraft, the antenna picks up the return signal. The electronics inside the radar measure the distance the same way the NXT US sensor does: by measuring the time it takes to send out the beam until it is received back at the antenna. In the case of the US sensor, this corresponds to the time it takes to transmit a sound till the US sensor hears the echo of the sound. The physics of these sorts of processes involve a certain amount of complicated detail, such as the importance of the wavelength of the ultra-sound or radio signal. The reader may consult the references cited at the end of this article for more information on radar systems.
Figure 1 below shows how US sensor measures the range and azimuth of a target. The range is the distance D to the target, and the azimuth a is the angle from a reference line, typically the front of the robot, to the target. The distance reading comes directly from the US sensor, and the azimuth comes from the rotation sensor in the motor rotating the sensor.
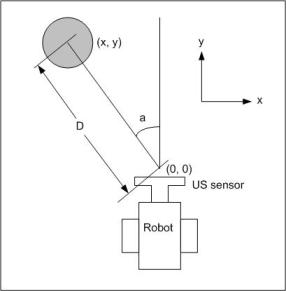
The problem requires that we determine the x, y coordinates of the round object given its distance D and its azimuth angle a. The solution requires the use of trigonometry - any good high school text on analytic geometry may be consulted for the details. In short, the x and y coordinates are given by the following formulas:
x = D sin(a) (1a)
y = D cos(a) (1b)
where
D is the distance to the object
a, the angle between the reference line and the direction the the sensor is pointing when it detects the object
In a simple radar system, the origin of the x y coordinate system is always the physical location of the radar antenna, or, in our case, the US sensor. Establishing the reference line is an arbitrary matter. However, tradition and common practice establishes the reference line as a line drawn from the center of the robot to its "front". Think of a ship with radar mounted on it. The reference line is exactly the line drawn from the center of the stern through the center of the bow. Thus the coordinates of a target are always relative to the direction the ship, or in our case, the robot, is traveling.
Implementing the polar to rectangular conversion so as to display a target on the NXT's display involves several considerations. First of all, the way pixels are addressed on the NXT display. Consulting the help for the NXT display block we find that the pixel in the exact center of the display (not the corners) has x, y coordinates of x = 49 and y = 31. Therefore, the coordinates calculated by the formulas 1a and 1b above must be "offset" by the location of the origin on the NXT display. Furthermore the x coordinates of the NXT display range from 0 to 99 while the y coordinates range from 0 to 63. Therefore, the values calculated by 1a and 1b must "scaled" to fit in the NXT display. Hence
x = SfD sin(a) + 49 (2a)
y = SfD cos(a) + 31 (2b)
where
Sf is the scale factor that "fits" the NXT display
Also, NXT-G has no trig functions and the programmer has access only to integer arithmetic to do calculations. Trig functions are defined on the Real numbers, that is, numbers which may have decimal points. NXT-G cannot handle decimal numbers - only integers. Integers are whole numbers that can be both negative and positive. (Negative integers have a minus sign in front of them.) Therefore, some numerical tricks must be used to perform trig calculations. The trick is to scale the trig functions by multiplying the trig values by some large, positive integer and rounding to the nearest whole number. After the trig functions are used, this scaling must somehow be "backed" out of the calculation. I use a scaling factor of 10,000 and an approximation function to calculate values for the cosine function. A detailed description of the development of this approximation function may be found in the reference cited at the end of this article.
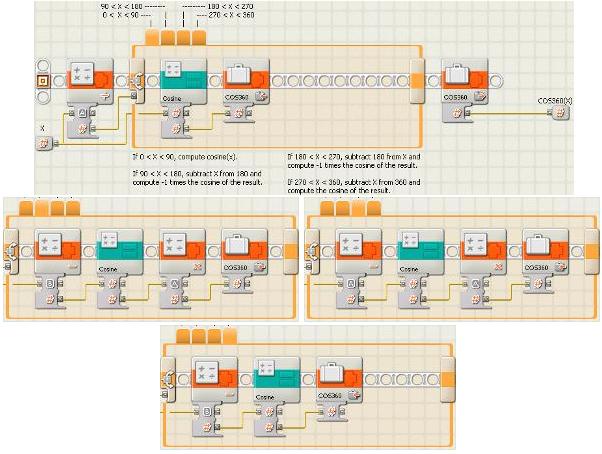
Since this cosine approximation function is only good for angles between 0 and 90 degrees, a NXT-G MyBlock is required to make the Cosine MyBlock useful for angles from 0 to 360 degrees. Again, the reader should refer to a good analytical geometry text book for the details of the math. Since NXT-G uses integer arithmetic, certain calculations have to be done in way which may not be intuitively obvious, however the method of calculation is necessitated in order to avoid round off errors. That is, with integer arithmetic dividing a smaller number by a larger number always results in zero. So, the calculation must be done using reciprocals. This brief discussion should help to explain the comments that you will find in the MyBlock that does the polar to rectangular conversion.
The NXT-G program and MyBlocks presented below implement the data driven version of Radar Display. Following the presentation you will find a picture how the main program might look for a sensor driven version of Radar Display.
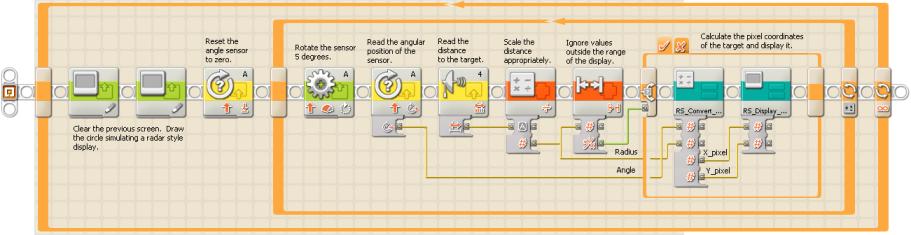
Figure 2 shows the main routine of data driven Radar Display program. As you can see, for each iteration of the inner loop two values get read from the data file. The first value is the azimuth angle (in degrees) of the sensor, and the second value is the distance to the target. If you look at the data file, all the data occur in pairs. Hence all the 1st, 3rd, 5th, ..., numbers in the file are angles, and the 2nd, 4th, 6th, ..., numbers are distances. The range block merely throws out values that are outside of the display capability of the NXT display.
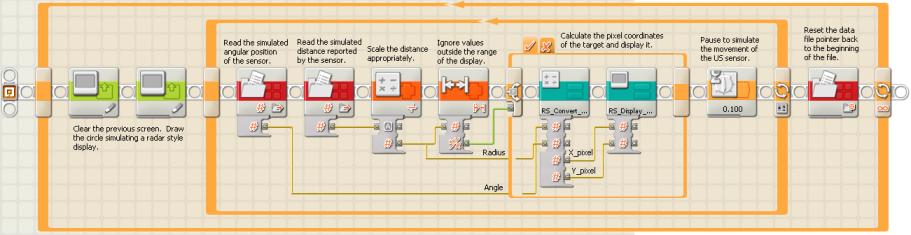
Figure 3 shows the MyBlock that does the polar to rectangular conversion. Dividing the result of the Cosine360 MyBlock by the reciprocal of the scaling factor may seem puzzling at first. However, as mentioned earlier, this is done to avoid problems with round off errors. Since the distance to a target (in centimeters) ranges from 1 to 200, dividing the distance into the cosine scaling factor of 10000 always results in a non-zero integer. Dividing the result so obtained into the value returned by the Cosine MyBlock results in the correct pixel coordinates.
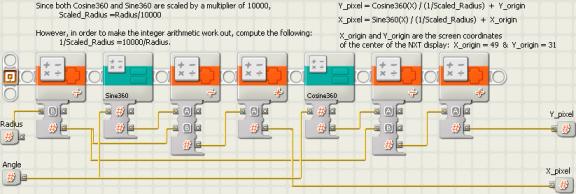
Figure 4 shows the Cosine360 MyBlock. There are four cases that must be handled depending on which quadrant of the circle our azimuth angle places us.
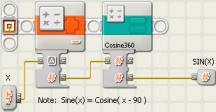
Note that sin(x) = cos( x - 90) when x is expressed in degrees. Figure 4 shows the Sine360 MyBlock.
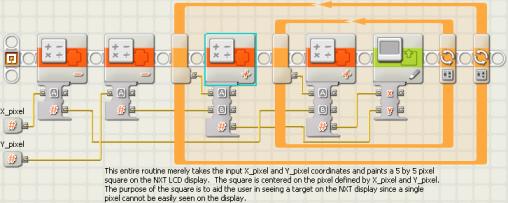
Finally, the Display MyBlock handles the actual "painting" of the target on the NXT display. This MyBlock takes the input pixel coordinates, representing the target seen by the US sensor, and paints a 5 pixel by 5 pixel square on the display. The square is centered at the input pixel coordinates. Painting a square, instead of a single pixel, makes a target blip much easier to see on the NXT display. Figure 6 shows the Display MyBlock.
Converting the main program shown in figure 2 to a sensor driven program depends a great deal on the mechanical design of your robot and how it moves the US sensor. The NXT blogs on the Internet show quite a variety of different designs. That is why I do not give a detailed program that actually uses the US sensor. However figure 7 below is intended to provide ideas about how such a program might look. The file access blocks have been replaced by a block that moves the sensor and a block that reads the sensor.
The Radar Display program is intended mainly to provide a demonstration about how to create a radar style display on the LCD display of the NXT. Don’t be fooled however by an application that only creates a display. The same method used to calculate the x,y coordinates of pixels can be used to create a map of a robot’s surroundings. The readings of from the US sensor can be stored in a data file which the program can then access and use to take appropriate actions. For example, the robot could scan its surroundings and then head directly toward the nearest object and make a circle around the object. (Sort of a NXT Chinese fire-drill!) Or the robot could find a path weaving its way between obstacles. The possibilities are really endless.